 Analytical Services
Our analytical services help organizations establish a data-driven strategy by transforming data into information to ensure competitive advantage and operational excellence.

ADVANTAGES
WHAT ARE THE ADVANTAGES AND OPPORTUNITIES FOR THIS SERVICE ?
Leveraging this service could help your organization in multiple ways: - Increase your efficiency - Shape your analytics strategy including analytics organization, processes and tech stack - Help you harness information to drive business insights - Automate tasks and improve processes

TECHNOLOGIES



DELIVERABLE
Project steps
- Data ingestion/integration framework - Data models - Reports / Dashboards / Scorecards - Architecture guide - Knowledge transfer

PROJECT CYCLES
Team Faction A schedules an initial meeting with you to analyze and define what your exact analytics needs are.
Once these steps are completed, we are able to assess the work to be done in order to fulfill the following mandates according to your criteria.
Planning will define the tasks and resources required to complete the deliverables of a project. A detailed project plan will outline the timeline, budget, and quality requirements for the project. This project plan will serve as roadmap for the project team, providing a clear understanding of what needs to be done, when it needs to be done, and who is responsible for doing it.
The architecture identifies the various component that will be used to collect, integrate, store and analyze data. It will also specify technology standards and data management and analytics best practices that will support the organization analytical projects.
Data integration involves collecting, cleansing, the transformation and integrating data from various sources into a central repository. This process involves data integration technologies and tools.
The quality of the data must be ensured through data profiling and cleansing, and metadata must be managed to maintain data lineage and accuracy.
Data modeling is the creation of a conceptual representation of data objects and the relationships between different objects. It is use to create a blueprint for how that data can be used to achieve specific business goals. it helps to ensure that the data being used is accurate, consistent, and relevant to the business needs.
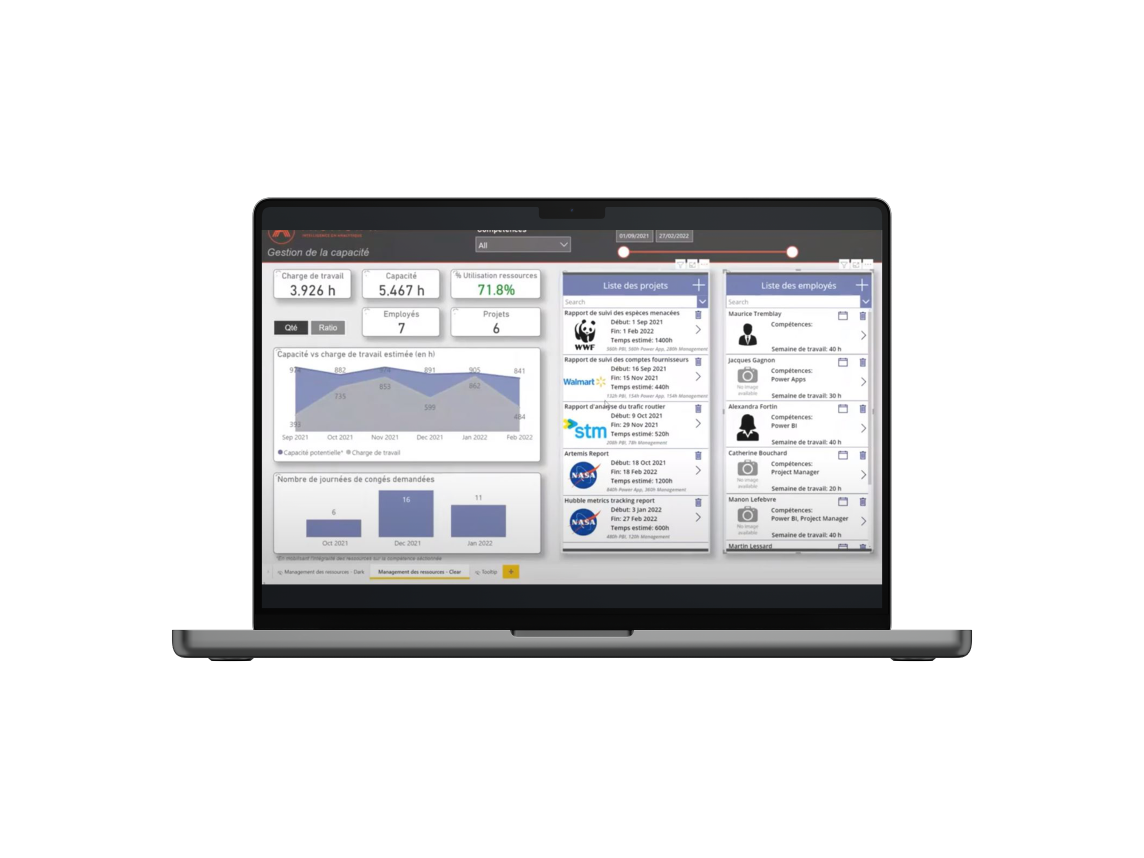
Data visualization is the process of presenting data in a graphical or pictorial format that is easy to understand and interpret. It is a way to communicate complex data in a simple and intuitive way, allowing decision-makers to quickly identify trends, patterns, and insights that might not be immediately apparent from raw data.
Advanced analytics is the use of complex techniques and tools to analyze data and extract insights that are not possible with traditional data analysis methods.
Advanced analytics techniques include predictive modeling, machine learning, data mining, and other statistical methods.

